Subscribe to the 100% free rdnewsNOW daily newsletter!
Sponsored

Market Watch — April 17, 2026

Apr 17, 2026 | 4:44 PM

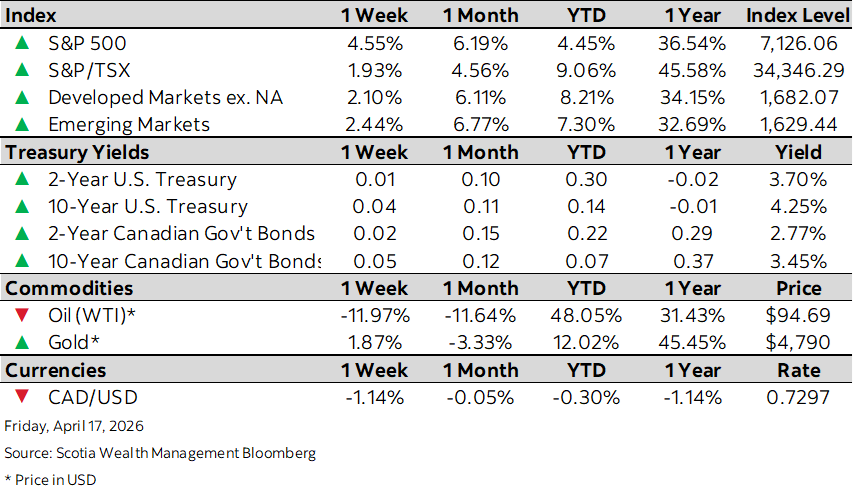
This week’s highlights

  • Equities continue recovery as peace hopes and earnings offset energy shock
  • Energy concerns push yields higher before reversing on tentative ceasefire
  • Canadian manufacturing sales recover to post 3.6% gain in February
  • U.S. producer prices increase less than expected in March
  • China’s economy starts year on strong footing, but Iran risks loom

Week in review

Equities continue recovery as peace hopes and earnings offset energy shock

U.S. equities started the week mostly positive, with only brief intraday pullbacks after failed U.S.–Iran talks, higher oil prices, and renewed inflation concerns following last Friday’s firm Consumer Price Index (CPI) print weighed on sentiment. Markets later found traction as hopes for resumed negotiations emerged and March Producer Price Index (PPI) surprised to the downside, easing near‑term inflation fears. Supportive jobless claims and early earnings strength in banks and large-cap technology reinforced the mid- to late-week rebound despite lingering policy uncertainty. Canadian equities tracked global risk appetite, pressured early by geopolitical risk but later steadied as macro data remained orderly and easing conflict concerns improved sentiment. In Europe, equities lagged as higher energy costs and disappointing luxury earnings overshadowed limited regional data, before stabilizing as oil prices moderated. Chinese and emerging market equities fluctuated but found support in stronger-than-expected Q1 GDP and industrial production, offsetting weak retail sales and softer trade data.

Highlights:

  • U.S. equities returned 4.55%1 shaped largely by geopolitics, but a softer-than-expected PPI report, stable jobless claims, and strong earnings from banks and technology helped calm inflation concerns and underpin risk appetite as the week progressed.
  • Canadian equities returned 1.93%2 initially pressured by geopolitical uncertainty, but supported later by steady domestic data expectations, easing energy price pressures, and improved sentiment as risks around inflation and growth appeared contained.
  • European stocks returned 2.10%3 facing early headwinds from elevated energy costs and weak luxury sector updates, with limited regional data to offset concerns, before stabilizing as oil prices eased and broader macro fears around inflation moderated late in the week.
  • Emerging markets rose 2.44%4 after a stronger-than-expected Q1 GDP and industrial output helped offset disappointing retail sales and weaker exports, while cautious optimism around global growth and energy prices supported sentiment.

Energy concerns push yields higher before reversing on tentative ceasefire

U.S. rates moved higher early in the week as the escalation in Middle East tensions drove crude prices sharply higher and reinforced concerns that energy‑led inflation could delay easing, before Treasuries found support after March PPI came in softer than expected and jobless claims remained contained. Yields later edged lower as geopolitical risks moderated and markets reassessed the persistence of inflation pressure. Canadian yields largely mirrored U.S. moves, with limited domestic data leaving markets primarily driven by global energy dynamics and shifting central‑bank expectations. In Europe, sovereign bonds initially sold off amid higher energy prices but rallied mid‑week as optimism for a ceasefire and renewed energy shipments emerged and growth risks were underscored by weaker sector-level news and IMF downgrades.

Highlights:

  • The 2- and 10-year U.S. Treasury yields were up 1 basis points (bps) and 4 bps, respectively. In Canada, the 2- and 10-year yields were up 2 bps and 5 bps, respectively. Bond yields and prices move inversely to one another.
  • Sovereign bonds sold off early as the Middle East oil shock lifted inflation expectations, before softer U.S. PPI, stable jobless claims, and easing conflict risks allowed yields to retrace modestly late week.
  • Investment‑grade and high‑yield credit proved resilient, supported by constructive early earnings and a calmer rates backdrop, with limited spread widening despite elevated energy prices and lingering geopolitical uncertainty.

Weekly dashboard


Canadian manufacturing sales recover to post 3.6% gain in February

Strength in the auto sector helped boost both manufacturing and wholesale sales in February as several auto assembly plants ramped up operations following planned maintenance and retooling shutdowns. According to Statistics Canada (StatCan), manufacturing sales rose 3.6% to $71.2 billion in February following a drop of 3.1% in January. In a separate report, StatCan reported wholesale sales, excluding petroleum, petroleum products, and other hydrocarbons, climbed 2% higher to total $86.8 billion in February.

Highlights:

  • Manufacturing sales rose in 12 of the 21 subsectors, led by an 18.8% gain in transportation equipment as auto production increased.
  • Sales in the machinery subsector also climbed higher as they increased 7.7% in February, while sales of primary metals hit a new record high, gaining 4.9% to $6.5 billion. Sales of chemical products fell 3.2% to $5 billion in February.
  • Wholesale sales increased in five of the seven subsectors, with the motor vehicle and motor vehicle parts and accessories subsector up 6.1%. The food, beverage and tobacco subsector rose 2.9%, while personal and household goods gained 2.5% in February.

U.S. producer prices increase less than expected in March

U.S. producer prices increased less than expected in March as the cost of services was unchanged, but surging energy prices because of the war with Iran were fanning inflation pressures. According to the U.S. Labor Department’s Bureau of Labor Statistics, the Producer Price Index (PPI) for final demand rose 0.5% last month after a downwardly revised 0.5% gain in February. Economists had forecast the PPI accelerating 1.1% after a previously reported 0.7% gain in February.

Highlights:

  • Most of the monthly gain came from goods rather than services. The index for final demand goods jumped 1.6%, its biggest monthly rise since August 2023, while prices for final demand services were essentially flat for the month.
  • Nearly half of the goods increase was attributable to a 15.7% surge in gasoline prices; the energy component overall rose 8.5%, with diesel, jet fuel and home heating oil also contributing to the advance.
  • The PPI measure that excludes foods, energy and trade services, a commonly watched core gauge, rose 0.2% for the month and 3.6% year-over-year, signalling persistent underlying price pressures.

China’s economy starts year on strong footing, but Iran risks loom

China reported accelerating economic growth to start the year, driven by robust exports, but shock waves from the Iran war threaten its momentum. China’s gross domestic product (GDP) expanded 5% in the first quarter of 2026 compared with a year earlier, up from 4.5% growth in the fourth quarter of 2025, according to government data. Trade helped drive much of China’s economic expansion, with exports surging 22% in January and February from a year earlier. But export growth slowed sharply in March, underscoring the risk of relying on global demand to boost the economy.

Highlights:

  • Though the better-than-anticipated GDP print was a welcome surprise, China’s single-engine economy is vulnerable to a potential global economic slowdown caused by the Middle East conflict, and some of that impact has already begun to show up in the March data.
  • In March, exports rose only 2.5% year-on-year against the median estimate of 8.6%, while imports climbed 27.8% led by purchases of high-tech products, causing China’s trade surplus to shrink to US$51.1 billion from US$91.0 billion.
  • Beijing has in some ways prepared for a slowdown in growth. Earlier this year, it set its lowest annual growth target in more than three decades, aiming for GDP growth of between 4.5% and 5%.

1  S&P 500 Index USD

2 S&P/TSX Composite Index USD

3 Bloomberg Developed Markets ex N. America Large & Mid Cap Price Return Index USD

4 Bloomberg EM Large & Mid Cap Price Return Index USD

Disclaimer: This publication has been prepared by The Bank of Nova Scotia for Scotia Wealth Management clients. It is for general information purposes only and should not be considered or relied upon as personal and/or specific financial, tax, pension, insurance, legal or investment advice. We are not tax or legal advisors, and we recommend that individuals consult with their qualified advisors, including tax and legal advisors, before taking any action based upon the information contained in this publication. The opinions and projections contained in this publication are our own as of the date hereof and are subject to change without notice. Scotia Wealth Management is under no obligation to update this publication, and readers should assume the information contained herein will not be updated. While care and attention has been taken to ensure the accuracy and reliability of the material in this publication, neither The Bank of Nova Scotia nor any of its affiliates or any of their respective directors, officers or employees make any representations or warranties, express or implied, as to the accuracy or completeness of such material and disclaim any liability resulting from any direct or consequential loss arising from any use of this publication or the information contained herein. This publication may contain forward-looking statements based on current expectations and projections about future general economic factors. Forward-looking statements are subject to inherent risks and uncertainties which may be unforeseeable and such expectations and projections may be incorrect in the future. Forward-looking statements are not guarantees of future performance and you should avoid placing undue reliance upon them. This publication and all the information, opinions and conclusions contained herein are protected by copyright. This publication may not be reproduced in whole or in part without the prior express consent of The Bank of Nova Scotia. To the extent this document contains information or data obtained from third party sources, it is believed to be accurate and reliable as of the date of publication, but Scotia Wealth Management does not guarantee its accuracy or reliability.

® Registered trademark of The Bank of Nova Scotia, used under licence (where applicable). ™ Trademark of The Bank of Nova Scotia, used under licence (where applicable). Scotia Wealth Management® consists of a range of financial services provided by The Bank of Nova Scotia (Scotiabank®); The Bank of Nova Scotia Trust Company (Scotiatrust®); Scotia Jarislowsky Fraser, a service of 1832 Asset Management L.P.; 1832 Asset Management U.S. Inc.; Scotia Wealth Insurance Services Inc.; and ScotiaMcLeod®, a division of Scotia Capital Inc. Private banking services are provided by The Bank of Nova Scotia. Estate and trust services are provided by The Bank of Nova Scotia Trust Company. Portfolio management is provided by 1832 Asset Management L.P. and 1832 Asset Management U.S. Inc. Insurance services are provided by Scotia Wealth Insurance Services Inc. Wealth advisory and brokerage services are provided by ScotiaMcLeod, a division of Scotia Capital Inc. International investment advisory services are provided by Scotia Capital Inc. Financial planning services are provided by The Bank of Nova Scotia and ScotiaMcLeod. Scotia Capital Inc. is a member of the Canadian Investor Protection Fund and is regulated by the Canadian Investment Regulatory Organization. Scotia Wealth Insurance Services Inc. is the insurance subsidiary of Scotia Capital Inc., a member of the Scotiabank group of companies. When discussing life insurance products, ScotiaMcLeod advisors are acting as Life Insurance Agents (Financial Security Advisors in Quebec) representing Scotia Wealth Insurance Services Inc.

Scotia Wealth Management® in The Bahamas consists of a range of financial services provided by Scotiabank (Bahamas) Limited and The Bank of Nova Scotia Trust Company (Bahamas) Limited, which are entities licensed to operate within The Bahamas. International private banking and international investment advisory services are provided by Scotiabank (Bahamas) Limited. International wealth structuring solutions are provided by The Bank of Nova Scotia Trust Company (Bahamas) Limited. ® Registered trademark of The Bank of Nova Scotia, used under licence.

Scotia Wealth Management® in the Cayman Islands consists of a range of financial services provided by Scotiabank & Trust (Cayman) Ltd. International private banking services, international investment advisory services, and international wealth structuring solutions are provided by Scotiabank & Trust (Cayman) Ltd., an entity licensed by the Cayman Islands Monetary Authority. ® Registered trademark of The Bank of Nova Scotia, used under license.

Scotia Wealth Management® in Jamaica consists of a range of Private Banking services provided by the Scotiabank Group of companies (Scotiabank®). ®Registered trademark of The Bank of Nova Scotia, used under licence.